
Global Broker Regulation Inquiry App
WikiFX
English
简体中文
繁體中文
English
Pусский
日本語
ภาษาไทย
Tiếng Việt
Bahasa Indonesia
Español
हिन्दी
Filippiiniläinen
Français
Deutsch
Português
Türkçe
한국어
العربية
DBG Markets: Market Report for Jan 30, 2026
Abstract:The Great De-Leveraging and the $5,500 Flash Crash; Whats Next for Gold, Silver Dollar?Yesterday, global markets witnessed one of the most violent de-leveraging events in recent history. A perfect st
The Great De-Leveraging and the $5,500 "Flash Crash"; Whats Next for Gold, Silver & Dollar?
Yesterday, global markets witnessed one of the most violent "de-leveraging" events in recent history. A perfect storm of corporate earnings, technical exhaustion, and a sudden U.S. Dollar bounce wiped out nearly $3 trillion in market capitalization from precious metals in a matter of hours.
The $5,500 Gold "Snap-Back": Why the Sharp Decline?
After Gold (XAU/USD) hit an unprecedented peak near $5,600 in the morning session, the "bubble" finally met its pin. The metal plunged nearly 7% to as low as $5,097 before finding its feet.
Why the crash? It is relatively straightforward: a massive wave of profit-taking followed a parabolic move. This is not uncommon after the recent "frothy" price action in Gold and Silver, which surged 25% and 60% respectively in January alone.
A liquidity flush happened. The move from $5,000 to $5,500 was largely driven by "FOMO" (Fear Of Missing Out). When the momentum turned, these late buyers were wiped out instantly, triggering a cascade of stop-loss selling.
Whats Next in Gold & Silver?
It is not unusual for a flash crash to occur after parabolic gains in a short period. Despite the "flash crash" yesterday, the structural narrative for precious metals remains the most discussed trade in the world. Here is the outlook we can expect in the near term:
Gold Outlook
The recovery from $5,097 back toward the $5,300–$5,400 zone suggests that the "buy the dip" mentality is still alive. However, as the market enters a period of "resting" after the parabolic move, expect consolidation next.
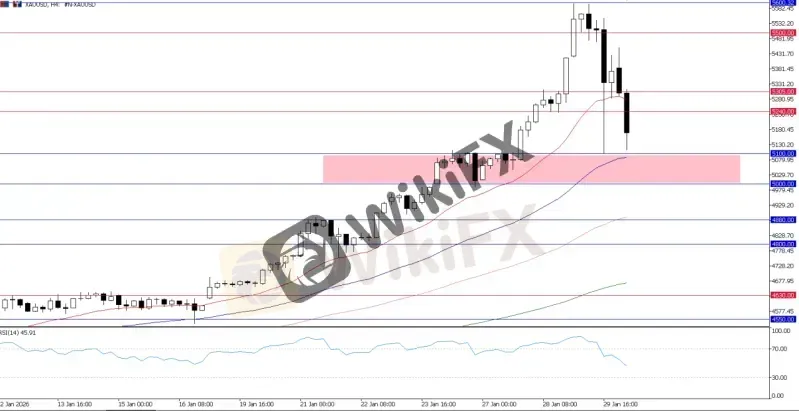
XAUUSD, H4 Chart
$5,100–$5,000 is now the critical must-hold floor. If this holds, it means the market still sees this as reasonable value for Gold, keeping it a favorable asset. If this support holds, we could see a broad consolidation within the $5,300–$5,000 range, where $5,300 now acts as a massive ceiling.
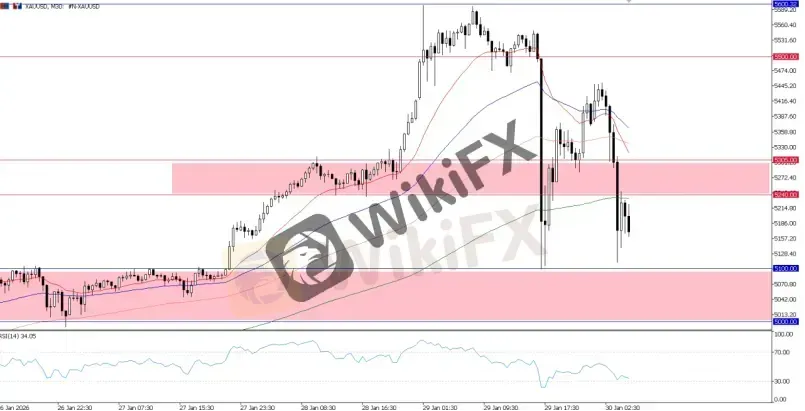
XAUUSD, M30 Chart
Over the near term, the $5,300–$5,100 zone remains the key consolidation level providing trading opportunities.
Outlook: $5,100–$5,000 remains the critical floor. A break below this would trigger another round of deeper pullbacks, meaning Gold may have a hard time regaining the "$5,000-era" in the near term. Otherwise, expect consolidation above $5,000 for now.
Silver Technical Outlook
Silver's move was less volatile in terms of points, but by percentage, it plunged nearly 12% yesterday, only to find some ground near $110.
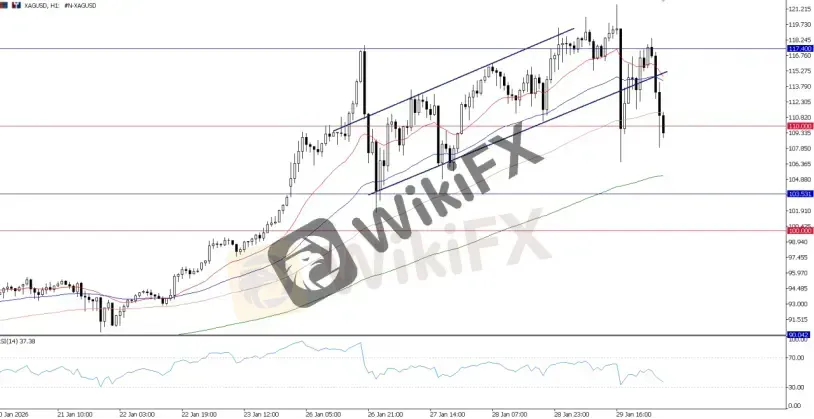
XAGUSD, H1 Chart
For now, the recent trend channel breakout could mean the end of the short-term uptrend, leading to consolidation or a short-term bearish corrective move. If we see a break below $110 today, tracking the profit-taking move in precious metals, another leg down toward the $103.5–$100 psychological level is a likely scenario.
Expect a period of "choppy consolidation" as the market licks its wounds.
US Dollar Rebound: Dead Cat Bounce or Trend Reversal?
The US Dollar Index (DXY) staged a relief rally yesterday, successfully defending the 96.00 handle and climbing toward 96.40. Slightly better-than-expected Initial Jobless Claims (209k) and a "Hawkish Hold" from the Fed (confirming no cuts in March/April) provided the Greenback with its first bit of traction in weeks.
Whats next for the Dollar?
On the bearish case, the long-term trend remains a "Sell-the-Rally," with most investors still seeing a “governance discount” due to political pressure in Washington and the Trump administration.
Additionally, Trump plans to announce a new Fed Chair later today or next week; citing that US rates will be lower under a new chair, this could provide another "governance discount" to the dollar.
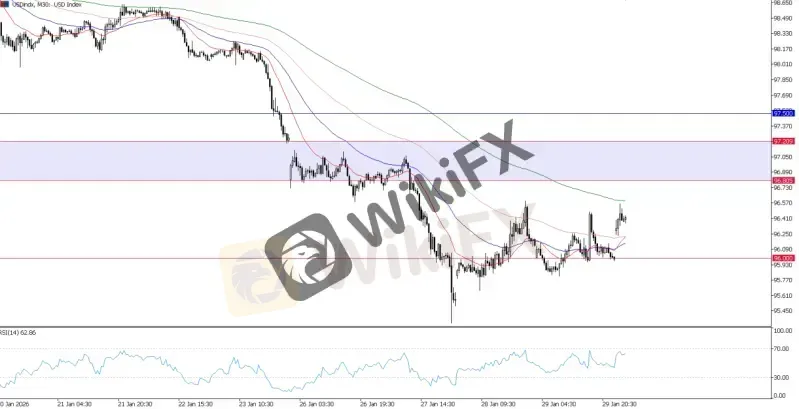
USD Index, M30 Chart
For now, the dollar shows a multiple bottom formed near 96.00, suggesting a likely short-term reversal. However, unless the dollar can decisively reclaim the 96.80 resistance, this bounce is likely just a corrective move. Watch the 96.00 support and the 96.80 resistance today. If it breaks down again, the path to 95.00 is wide open.
Bottom Line: Euphoria Meets Reality
Yesterday was a stark reminder that even the strongest bull markets do not move in a straight line. The "flash crash" has successfully flushed out the weak hands and reset technical indicators.
· Gold/Silver: The macro drivers (debt, tariffs, Fed independence) haven't changed, but the parabolic velocity has been checked.
· Equities: The 7,000 level for the S&P 500 remains a battlefield.
· Strategy: Be patient. The market needs to consolidate these massive swings. Look for stability above $5,100 (Gold) and $100 (Silver) before aggressively rebuilding long positions.
Disclaimer:
The views in this article only represent the author's personal views, and do not constitute investment advice on this platform. This platform does not guarantee the accuracy, completeness and timeliness of the information in the article, and will not be liable for any loss caused by the use of or reliance on the information in the article.
WikiFX Broker
Latest News
Telegram Investment Scam Wiped Out RM91,000 in Days
 WikiFX
SPEC TRADING Review 2026: Is this Forex Broker Legit or a Scam?
WikiFXGold Smashes $5,100 Barrier: Dalio Warns of 'Capital Wars'
WikiFXFiscal Policy Monitor: Authorities Tighten Tax Compliance Framework
WikiFXAMBER MARKETS Review 2026 — Is AMBER MARKETS Broker Safe for Forex Trading?
WikiFXWho are the “Police” Watching Your Forex Broker? (FCA, ASIC, NFA Explained)
WikiFXDollar Index Hits Four-Year Low as 'Fed Whisperer' Signals Rate Pause
WikiFXPayPal Re-enters Inbound Nigerian Market via Paga Partnership
WikiFXGerman Capital Flows Heavy into China, Defying Trade War Risks
WikiFXFIBOGROUP Review: Safety, Regulation & Forex Trading Details
WikiFXCurrency Calculator
USD

CNY
Current Rate: 0
Amount
USD
Available
CNY
Calculate